Plots of individual detections
We provide a Python script to visualize the FELINE output. The Automatic Usage executes it as well.
The FELINE output contains a raw 32bit data of four arrays - each with X \(\times\) Y spatial dimension:
- quality , a float32 which reflects the score of the best matching template for this spaxel
- template, an int32 the corresponding template of the best match
- redshift, a float32 of the corresponding redshift of the best match
- used , an int32 with the number of used line(pairs) in the template
The plot script creates a multipage PDF document with one page per potential galaxy for quick manual checking and verification ordered by quality of the detection:
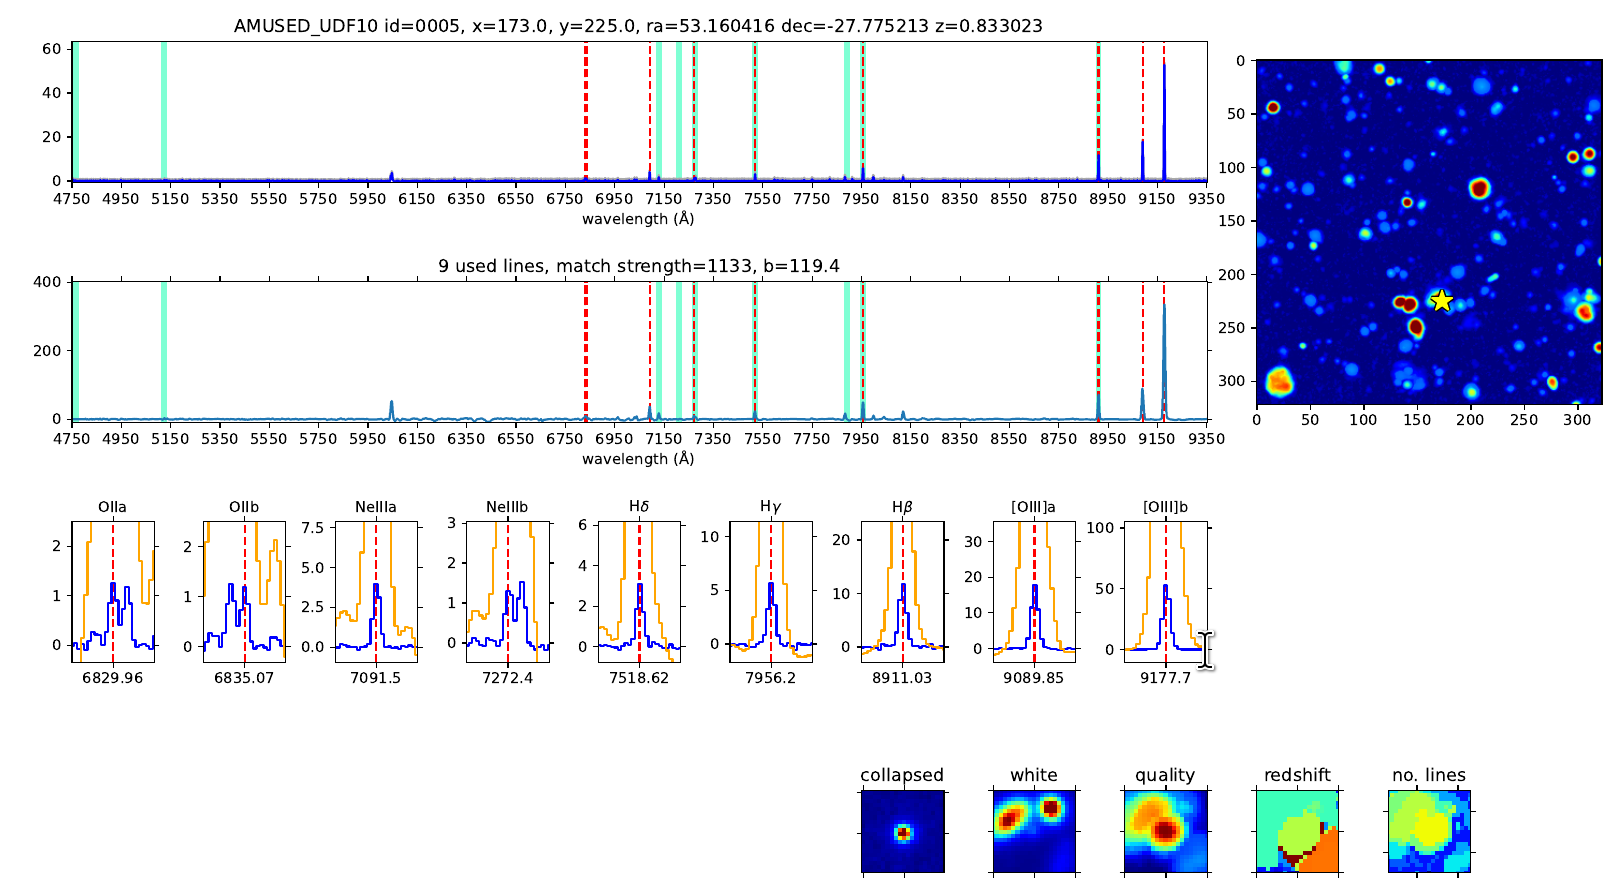
In the the top right the plot shows the full quality map of the field of view with a yellow asterix marking the spatial position of the plotted object. Left of it two large spectral windows are shown. In top graph shows in blue the median filtered data, and in grey the original data from the input cube (i.e., with continuum flux if present). The number of used lines and the total template qualify (arbitrary units) are listed as well as the impact parameter in kpc with respect to the FOV’s center at the detected redshift.
Below, the 1D spectrum of the matched filtered data is shown. Vertical black dotted lines mark the positions of potential lines, whereas red lines indicate detected emission features. Cyan bars mark indicate regions of possible absorption as additional information.
Under the full spectra is a series of zoom-in windows for each detected emission line of a galaxy template. The median filtered flux is plotted in blue and the matached filter signal in orange.
The bottom right shows five spatial maps to help the researcher to evaluate the detection. From left to right it represents the collapsed flux around each detected emission line, the total white image of the object area, the corresponding quality signal, the redshift map for that section as well as the total number of lines corresponding to the best match. The last three images are direct crops of the FELINE output array. The color gradient is only implemented to enhance the contrast. In the above example it is clearly shown, that the detected galaxy is not very strong in the conntinuum and easily missed by image based detections.