FELINE
The FELINE (Find Emission LINEs) algorithm then evaluates the likelihood in each spectrum of the 3D data cube for emission lines at the positions provided by a given redshift and a certain combination of typical emission features.
FELINE does not evaluate the observed data cube directly, but instead utilizes the result of an emission line matched filter to boost the signal-to-noise of any such feature in the data cube. We use LSDcat to create such a filtered data cube. FELINE, however, does not pick individual peaks from that data as separate objects but instead simultaneously assesses the accumulative signal at all spectral positions that correspond to a certain set of emission lines at any redshift within the range of interest.
FELINE probes all possible combinations of up to 14 transitions paired in 9 groups: \(\rm{H}\alpha, \rm{H}\beta, \rm{H}\gamma, \rm{H}\delta, \rm{[O II]}, \rm{[O III]}, \rm{[N III]}, \rm{[S II]} \text{ and } \rm{[Ne III]}\) for the full redshift range of interest (e.g., \(0.4 < z < 1.4\)). This particular selection of lines is motivated by the most prominent emission features expected in the MUSE data within the redshift range of \(\rm{[O II]}\) emitters. This results in 512 \((2^9)\) different models that are assessed at roughly 8,000 different redshifts for each of the \(\approx 90,000\) spectra in a single data cube.
FELINE was utilized in the following publications:

In our research we use a dual galaxy identification process based both on continuum (using SExtractor) and on
emission lines using FELINE. Overall, we find that up to one third of our detected galaxies have no continuum
detection within our magnitude limit.
This histogram from the MEGAFLOW XII paper (Fig. 15) reflects
this typical usecase of FELINE. It shows that there is a significant population of galaxies detected solely based on their emission line with FELINE.
For further Information see the JOSS Paper.
Thresholds
To ensure that only lines above a certain S/N threshold contribute to each model, a penalty value is subtracted for each additional line:
sum = sum - lines_ptr * scale * significance;
The scale parameter (default = 10) enhances the signal of every considered line.
significance describes the minimum significance an additional line must have to result in
a net positive impact on the evaluation sum of the currently tested model (example: 7).
This means that an additional feature below this significance has 0 effect on the final score.
When running FELINE, the user also specifies a max_match parameter beyond which
a line’s additional significance is only added as logarithmic value (example: 20).
This prevents extremely strong signals from dominating the parameter space.
For each spaxel the model with the highest accumulative probability over all contributing lines and its corresponding redshift are determined. This approach has the benefit to pick up extremely weak emitters that show multiple emissions lines while avoiding the deluge of false positives when looking for single lines below a certain S/N threshold. This can be applied to each spatial element independently and was thus fully parallelized.
Result
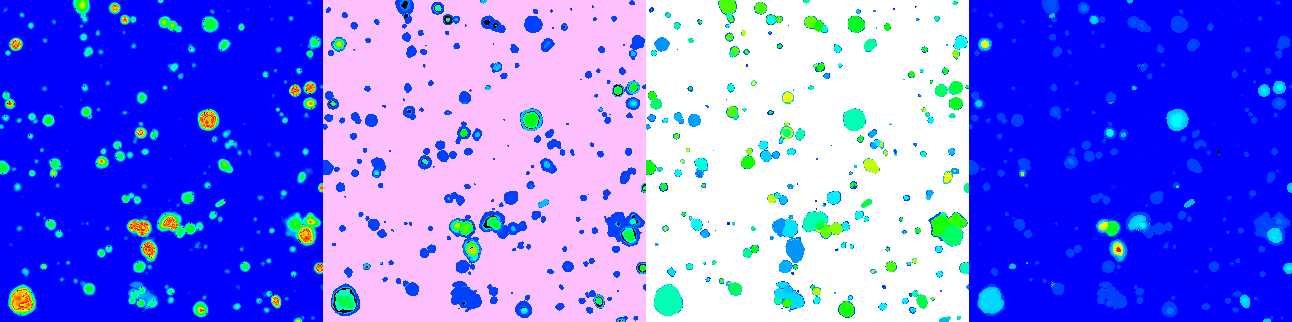
FELINE creates an binary file that contains the information that is being plotted during the evaluation (if an SDL environment is present). The created file contains raw 32bit data of four arrays - each with X \(\times\) Y spatial dimension:
quality, a float32 which reflects the score of the best matching template for this spaxeltemplate, an int32 the corresponding template of the best matchredshift, a float32 of the corresponding redshift of the best matchused, an int32 with the number of used line(pairs) in the template
The latter simply representing a bit-count of the template integer value.
Command line parameters
./feline.bin <ZLOW> <ZHIGH> <MAX_MATCH> <IGNORE_BELOW>
ZLOW and ZHIGH set the range of the redshift of interest. E.g., 0 - 1.9 (as in the example)
MAX_MATCH is the threshold for very bright features. 10 yields reasonable results for all data cubes we handled. If you explicitly aim for weak objects, values in the range up to 20 can be tested. This parameter is not very critical.
IGNORE_BELOW is the numerical value below which a feature in the matched filter signal-to-noise cube does not contribute to the template score. Our example uses a value of 3 which is also the used value for our runs on MUSE data cubes.
Postprocessing illustration
We provide an exemplary Python framework to visualize and verify the FELINE results.
From the resulting spatial map of best model probabilities, the peaks are automatically selected via maximum filter and 1D spectra are extracted from the median filtered data cube for each emission line galaxy candidate. Those extracted spectra are fitted with the corresponding emission line galaxy template and its redshift. In addition to the individual line strengths, the redshift is the only free parameter to reach sub pixel accuracy in an early redshift estimate and in deriving further diagnostics for the later manual inspection.
Modifications
The used set of lines is prominently defined in feline.c:
const float lines_first[11] = {6564.61, 4862.72, 4341.68, 4102.89, 3727.09, 4960.30, 6549.86, 6718.29, 3869.81, 1908.73, 1215.67};
const float lines_second[11] ={   0   ,    0   ,    0   ,    0   , 3729.88, 5008.24, 6585.27, 6732.67, 3968.53, 1906.68,    0   };
The plotting and catalog extraction tools use the common JSON list in data/lookup/atoms.json
If you intend to enhance or change the line list drastically, feel free to contact me for support.